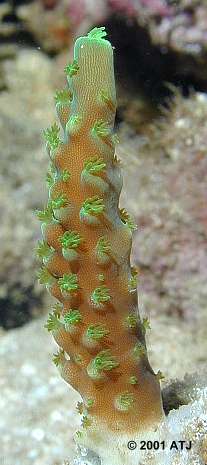
Figure 1: Subject 1 - Acropora "Dallas Warren" fragment.
This lab was carried out as part of the MACO Coral Biology course.
The purpose of this study was to measure the growth rate of a number of corals over a set period and project the annual growth rate of the colony.
Three scleractinians were measured for skeletal growth: Acropoa "Dallas Warren" ((Scleractinia: Acroporidae), Seriatopora hystrix (Scleractinia: Pocilloporidae) and Fungia sp. (Scleractinia: Fungiidae) and one for polyp division: Favia sp, (Scleractinia: Faviidae). Additionally, subjective assessments of growth were made from photographs of: Isis sp. (Alcyonacea: Isididae) and Sarcophyton sp. (Alcyonacea: Alcyoniidae).
Figure 1: Subject 1 - Acropora "Dallas Warren" fragment.
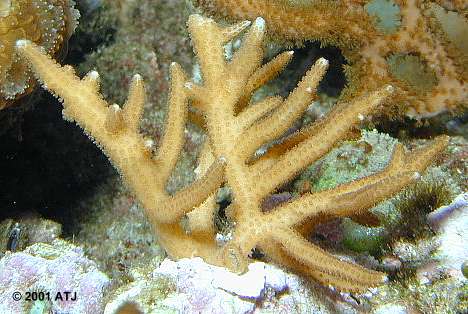
Figure 2: Subject 2 - Seriatopora hystrix fragment.
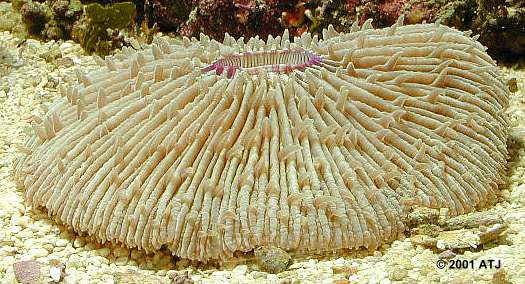
Figure 3: Subject 3 - Fungia sp.
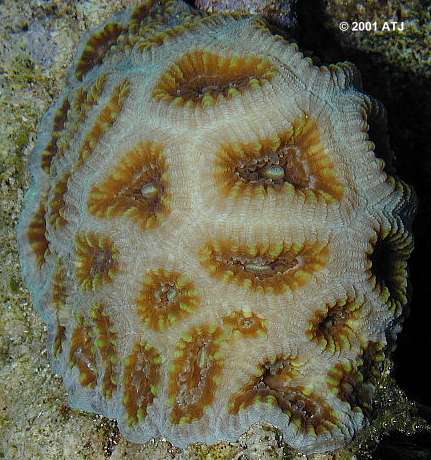
Figure 4: Subject 4 - Favia sp.
All measurements were carried out under water in the tank either because the subjects were attached or to reduce the chances of injury to the subjects.
Subject 1: The total height of the Acropora "Dallas Warren" fragment was measured. This was from the start of the coenosarc at the base of the fragment to tip of the single axial corallite.
Subject 2: The left most branch of the Seriatopora hystrix fragment was measured. This was from the bottom most branch to the tip.
Subject 3: The total diameter of the Fungia sp. corallite was measured. As the corallite is not perfectly circular, the longest diameter was measured.
Subject 4: The number of polyps/corallites of the Favia sp. were counted. As some corallites are on an inaccessible undersurface, these were not included in either count.
Table 1: Measurements for Subject 1
| Date | Height (mm) |
| May, 26, 2001 | 30 |
| June 11, 2001 | 34 |
Notes: The bulk of the "growth" was growth of the coenosarc down the base to the rock the colony was attached. This is the typical encrusting observed with Acropora spp. (Highsmith, 1982). This means it is not possible to estimate the annual growth rate at this stage.
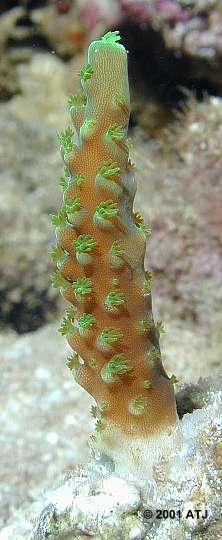
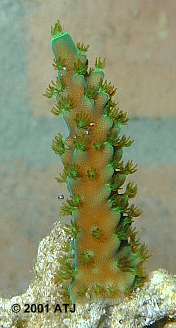
Figure 5: Subject 1 - Acropora "Dallas Warren". The picture on the left was taken on May 21 and shows the bare patch of skeleton between the bottom of the coenosarc and the attached substrate. The picture on the right was taken on June 11 and shows the based has been encrusted.
Table 2: Measurements for Subject 2
| Date | Height (mm) |
| May, 26, 2001 | 28 |
| June 11, 2001 | 29 |
| June 16, 2001 | 30 |
Figure 6a: Subject 2 - Seriatopora hystrix on May 21.
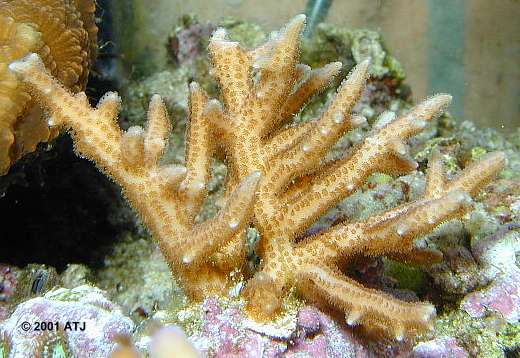
Figure 6b: Subject 2 - Seriatopora hystrix on June 16.
In addition to growing 2 mm over 21 days the tip of the branch in question has started to split. The estimated annual linear growth rate is 25 mm.
Table 3: Measurements for Subject 3
| Date | Diameter (mm) | Area (mm2) |
| April 21, 2001 | 90 | 6362 |
| June 14, 2001 | 92 | 6648 |
In 54 days, the outward growth was 2 mm and the area increased by 286 mm2. If the outward growth is linear, the estimated annual growth rate is 13.5 mm. If the increase in area is linear, the annual area growth rate is 1933 mm2.
Table 4: Corallite counts for Subject 4
| Date | Corallites |
| April 21, 2001 | 12 |
| June 14, 2001 | 27 |
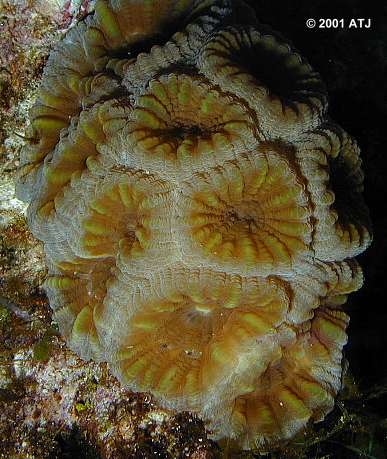
Figure 7a: Subject 4 on December 3, 2000
Figure 7b: Subject 4 on June 11, 2001
Notes: Some corallites are on the right underside of the colony and can not be easily counted and the colony cannot be removed. It is estimated that any polyp divisions in the non-visible area will be in line with polyp divisions of the rest of the colony.
The number of corallites/polyps increased by 15 in 190 days. At the same rate of polyp division, the annual division rate would be approximately 29 divisions per year.
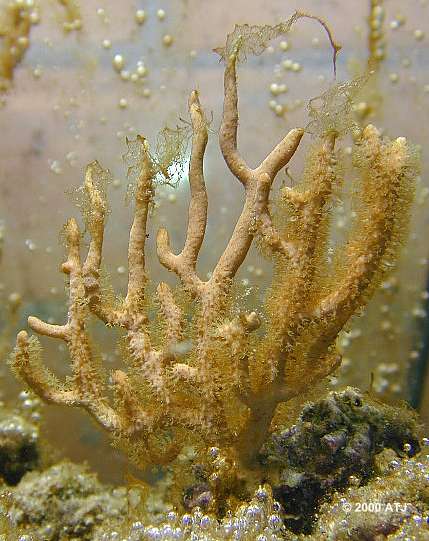
Figure 8a: Subject 5 on June 8, 2000
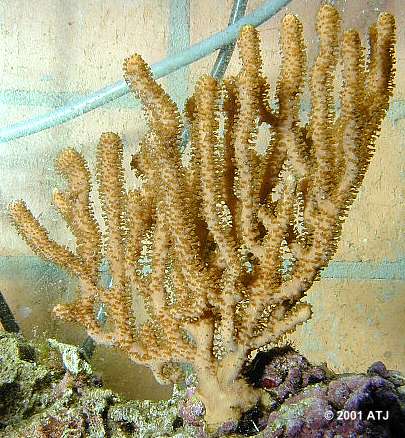
Figure 8b: Subject 5 on June 11, 2001
This Isis sp. gorgonian has shown significant growth over a 12 month period. It has gone from 21 branches in a single plane to over 30 branches in three vertical layers.

Figure 9a: Subject 6 on June 8, 2000
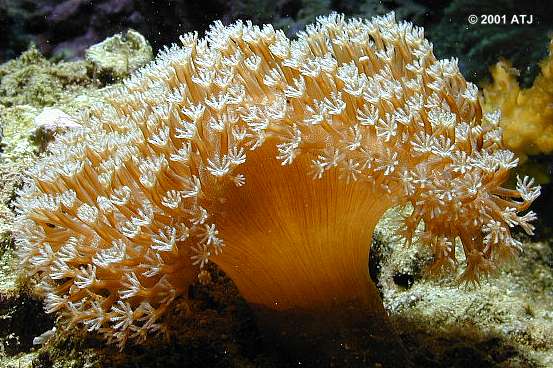
Figure 9b: Subject 6 on June 11, 2001
In 12 months, this Sarcophyton sp. has grown considerably.
The growth rate of the Acropora "Dallas Warren" can not yet be estimated as the colony spent the observation period encrusting its base. Continued weekly measurements of the colony should assist in determining when linear growth begins and then assessing the rate of linear growth.
The linear growth rate of the Seriatopora hystrix is estimated 25 mm per annum. Subsequent measurements over a number of weeks and months should be sufficient to confirm the estimated growth rate.
The diameter of the Fungia sp. increased by 2 mm over 54 days. This is equivalent to an increase in area of 286 mm2. Subsequent measurements will be required to determine if the diameter will continue to grow linearly or whether it is the area that grows this way.
In 190 days, the Favia sp. exhibited an increase of 15 corallites, which means there were 15 polyp divisions. The estimated number of divisions per year is 19. Subsequent counts over a period of months should confirm this estimate.
There are a number of factors that will influence growth and growth rates corals (and most organisms). The most important of these is nutrition. The coral must first be able to satisfy its daily metabolic needs. If the coral is diseased or injured, surplus energy will be directed to fight the disease or repair tissue. After these activities are satisfied, remaining energy can be used for growth (Borneman, 2000). Additionally, especially in the case of scleractinian corals, sufficient quantities of calcium and bicarbonate must be available for calcification and skeletogenesis. Intensity and duration of light can also affect the growth rate of corals either through the direct affect on the quantify of photsynthates from the symbiotic zooxanthellae, or by the increase in calcification in scleractinian corals assisted by the photosynthesis.
The measured growth rates of the corals in the study may have been influenced by the above factors. The light intensity and photo period over the period of the study was not constant, mainly due to the introduction and subsequent acclimation of new corals, including Subjects 1, 2 and 3. Additionally, calcium and bicarbonate levels may not have been consistent from day to day. It is assumed that over a longer period of measurement, these factors will average out. This is especially true if both the calcium and bicarbonate levels exceed the minimums required by the corals.
Borneman E.H. 2000. Coral Nutrition: Polyps not Plants!. Presentation to Western Marine Conference :.
Highsmith R.C. 1982. Reproduction by fragmentation in corals. Mar. Ecol. Prog. Ser. 7:207-226.
Last updated: 22 June 2001